All features

Cloudesk Reports & dashboards

Ask your business a question, and see the answer.

Pick what to look at — invoices, payments, bills, the ledger, store and sales orders, deals, stock, work orders, inspections, maintenance, shipments, campaigns, people and time — group it by month, customer, salesperson or anything else, add the totals you want, filter it, and see it as a table or a chart. Put reports on dashboards with KPIs that show the change from the period before, and have the ones you read every Monday emailed to the team.

Reports on a phone

Real screenshots from the app, using a demo workspace.

How it works

Three steps, no surprises

  1. 1

    Pick the data

    Each dataset is one kind of record from a module you have switched on, with the fields you can group by, measure and filter on.

  2. 2

    Ask the question

    Group by up to three fields (dates by day, week, month, quarter or year), measure totals, counts, averages or distinct counts, filter, and choose the dates: this month, last quarter, this financial year…

  3. 3

    Keep and share it

    Save it, put it on a dashboard, show it as a KPI against the period before, or email it on a schedule.

The tour

Every tool, up close.

  1. 01Build a report

    Pick the data, group it, chart it.

    Choose a kind of data, group it by any field, and total, count or average what you need. Show it as a table, bars, a line, an area, a donut or a single number.

    • Data from across your workspace
    • Group by up to three fields
    • Filters and date ranges
    The report builder: deals grouped by stage, total value shown as bars
  2. 02Dashboards

    Your numbers, side by side.

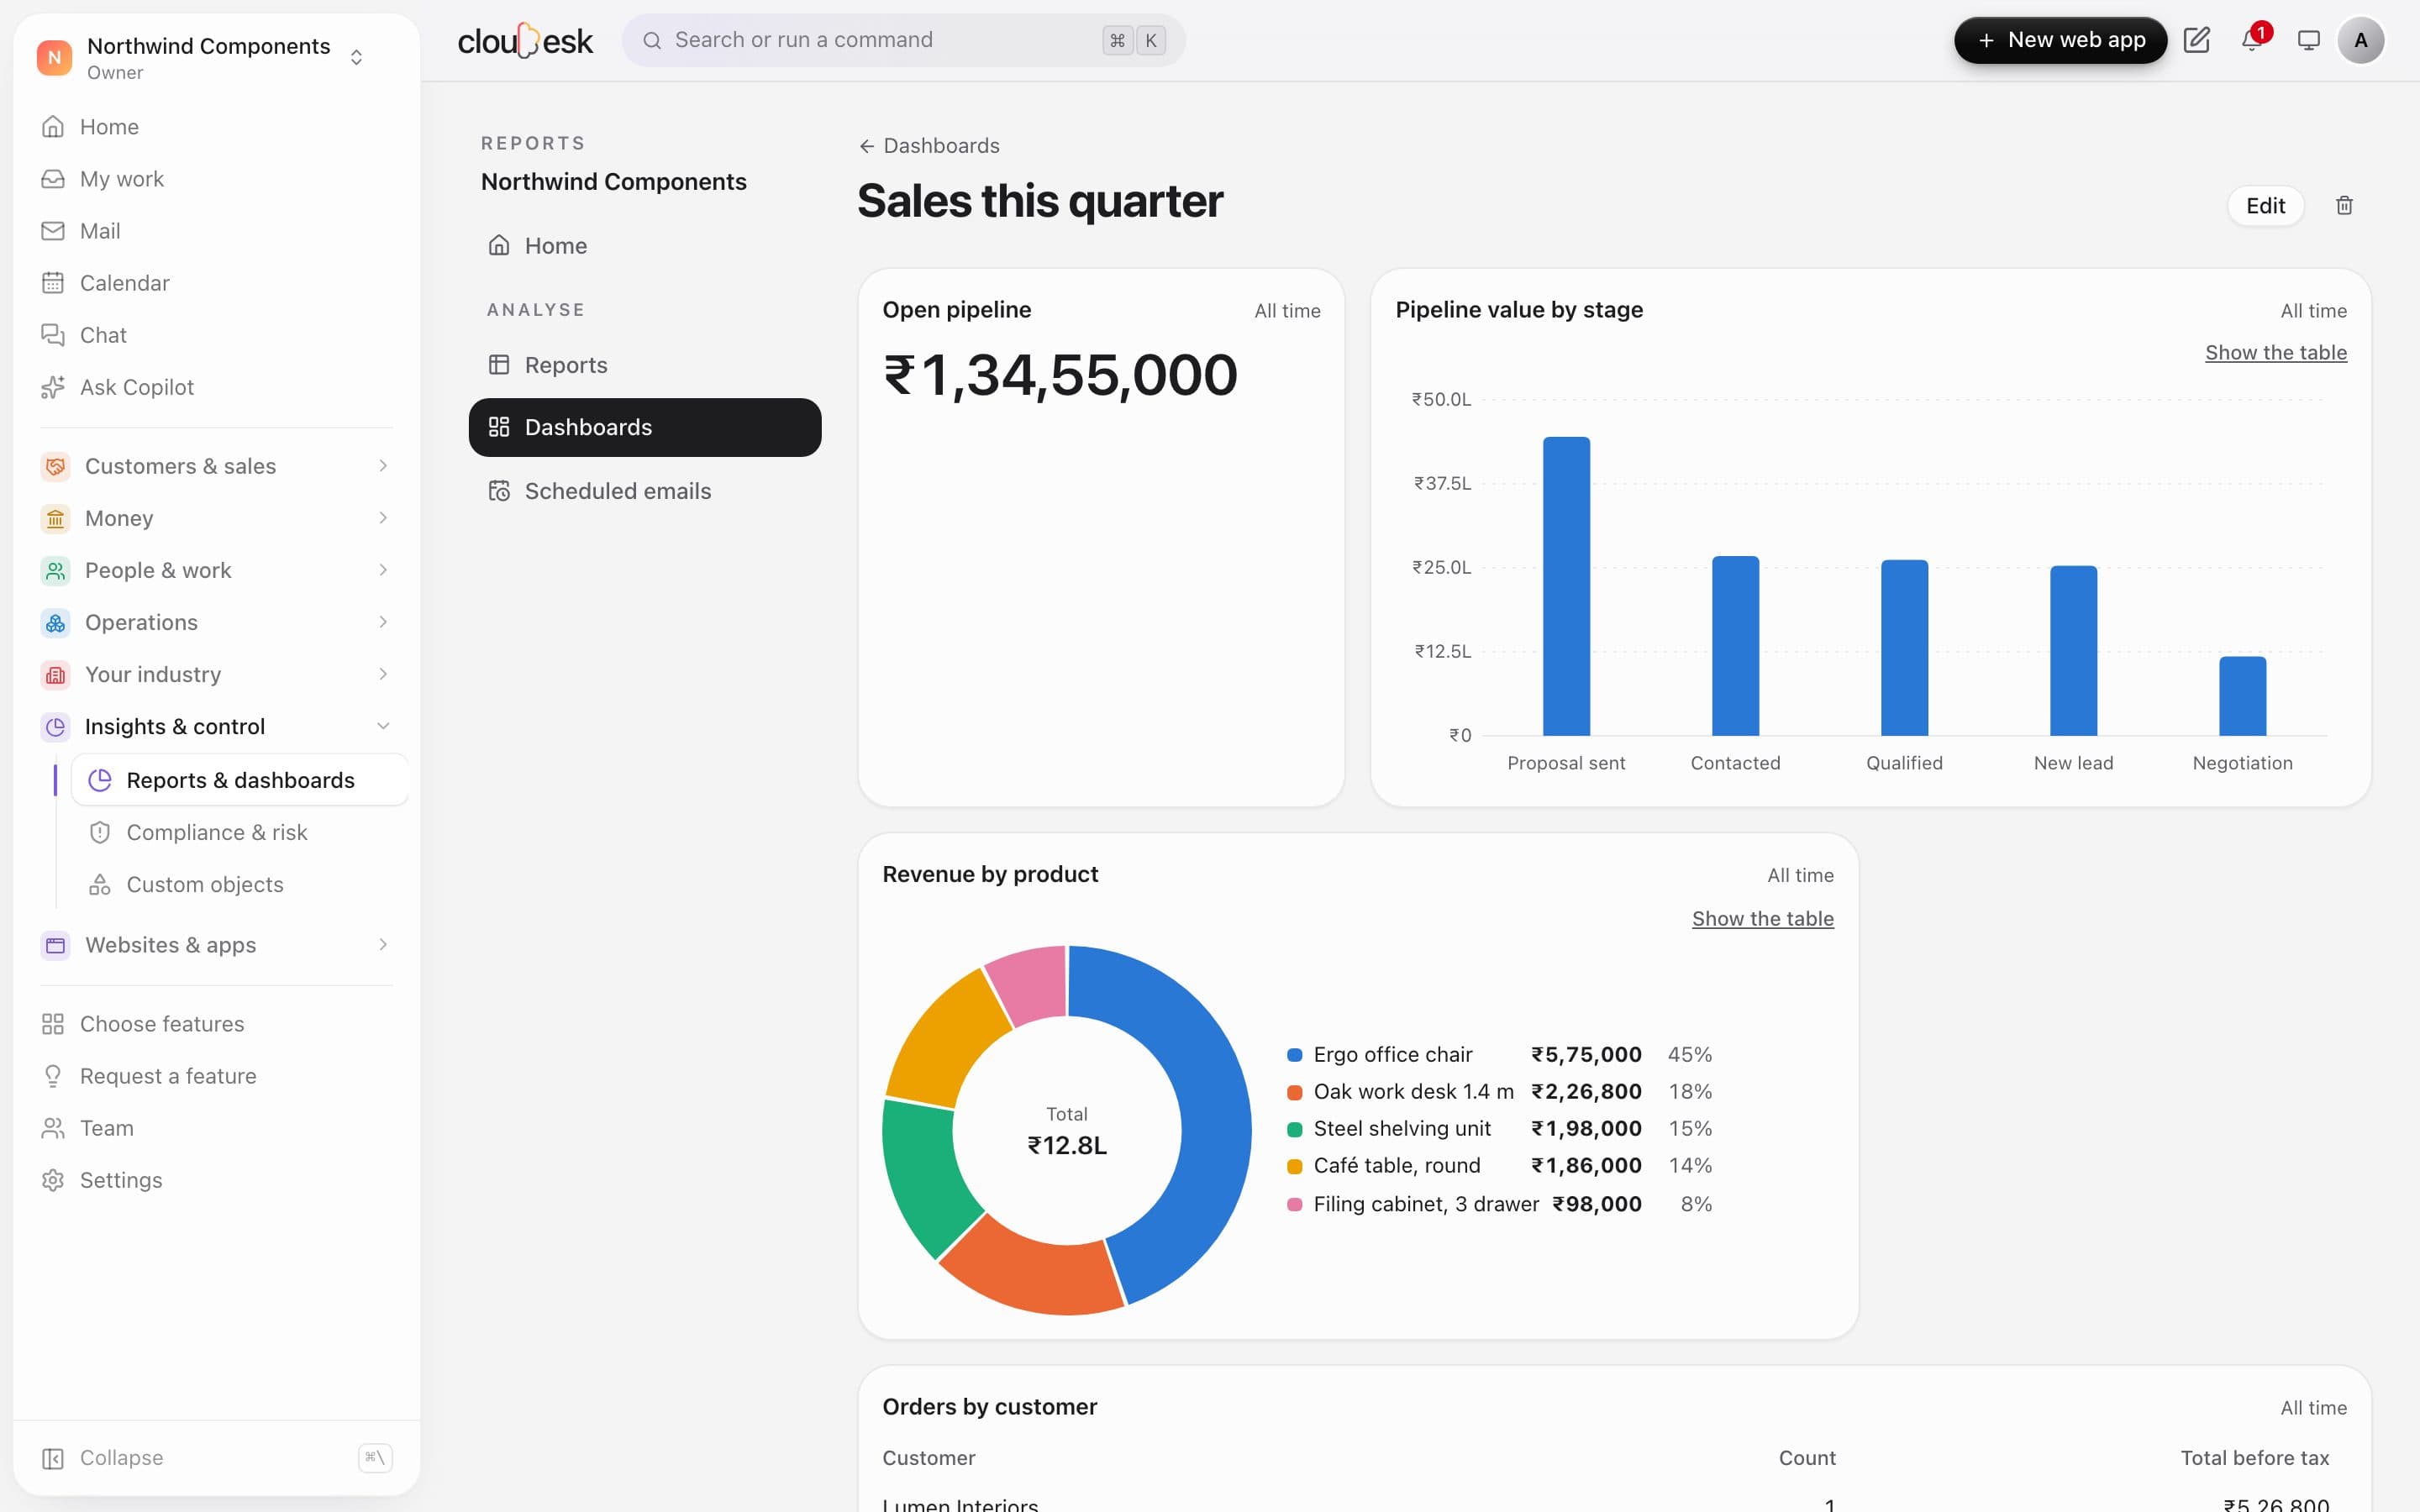
    Put saved reports on a dashboard as numbers, charts and tables, and share it with the team. Each tile runs live on your current data.

    • Small, medium and large tiles
    • A target for a single number
    • Shared with the team or kept private
    A sales dashboard with a number, bars and a donut
  3. 03Scheduled emails

    Monday morning, already in the inbox.

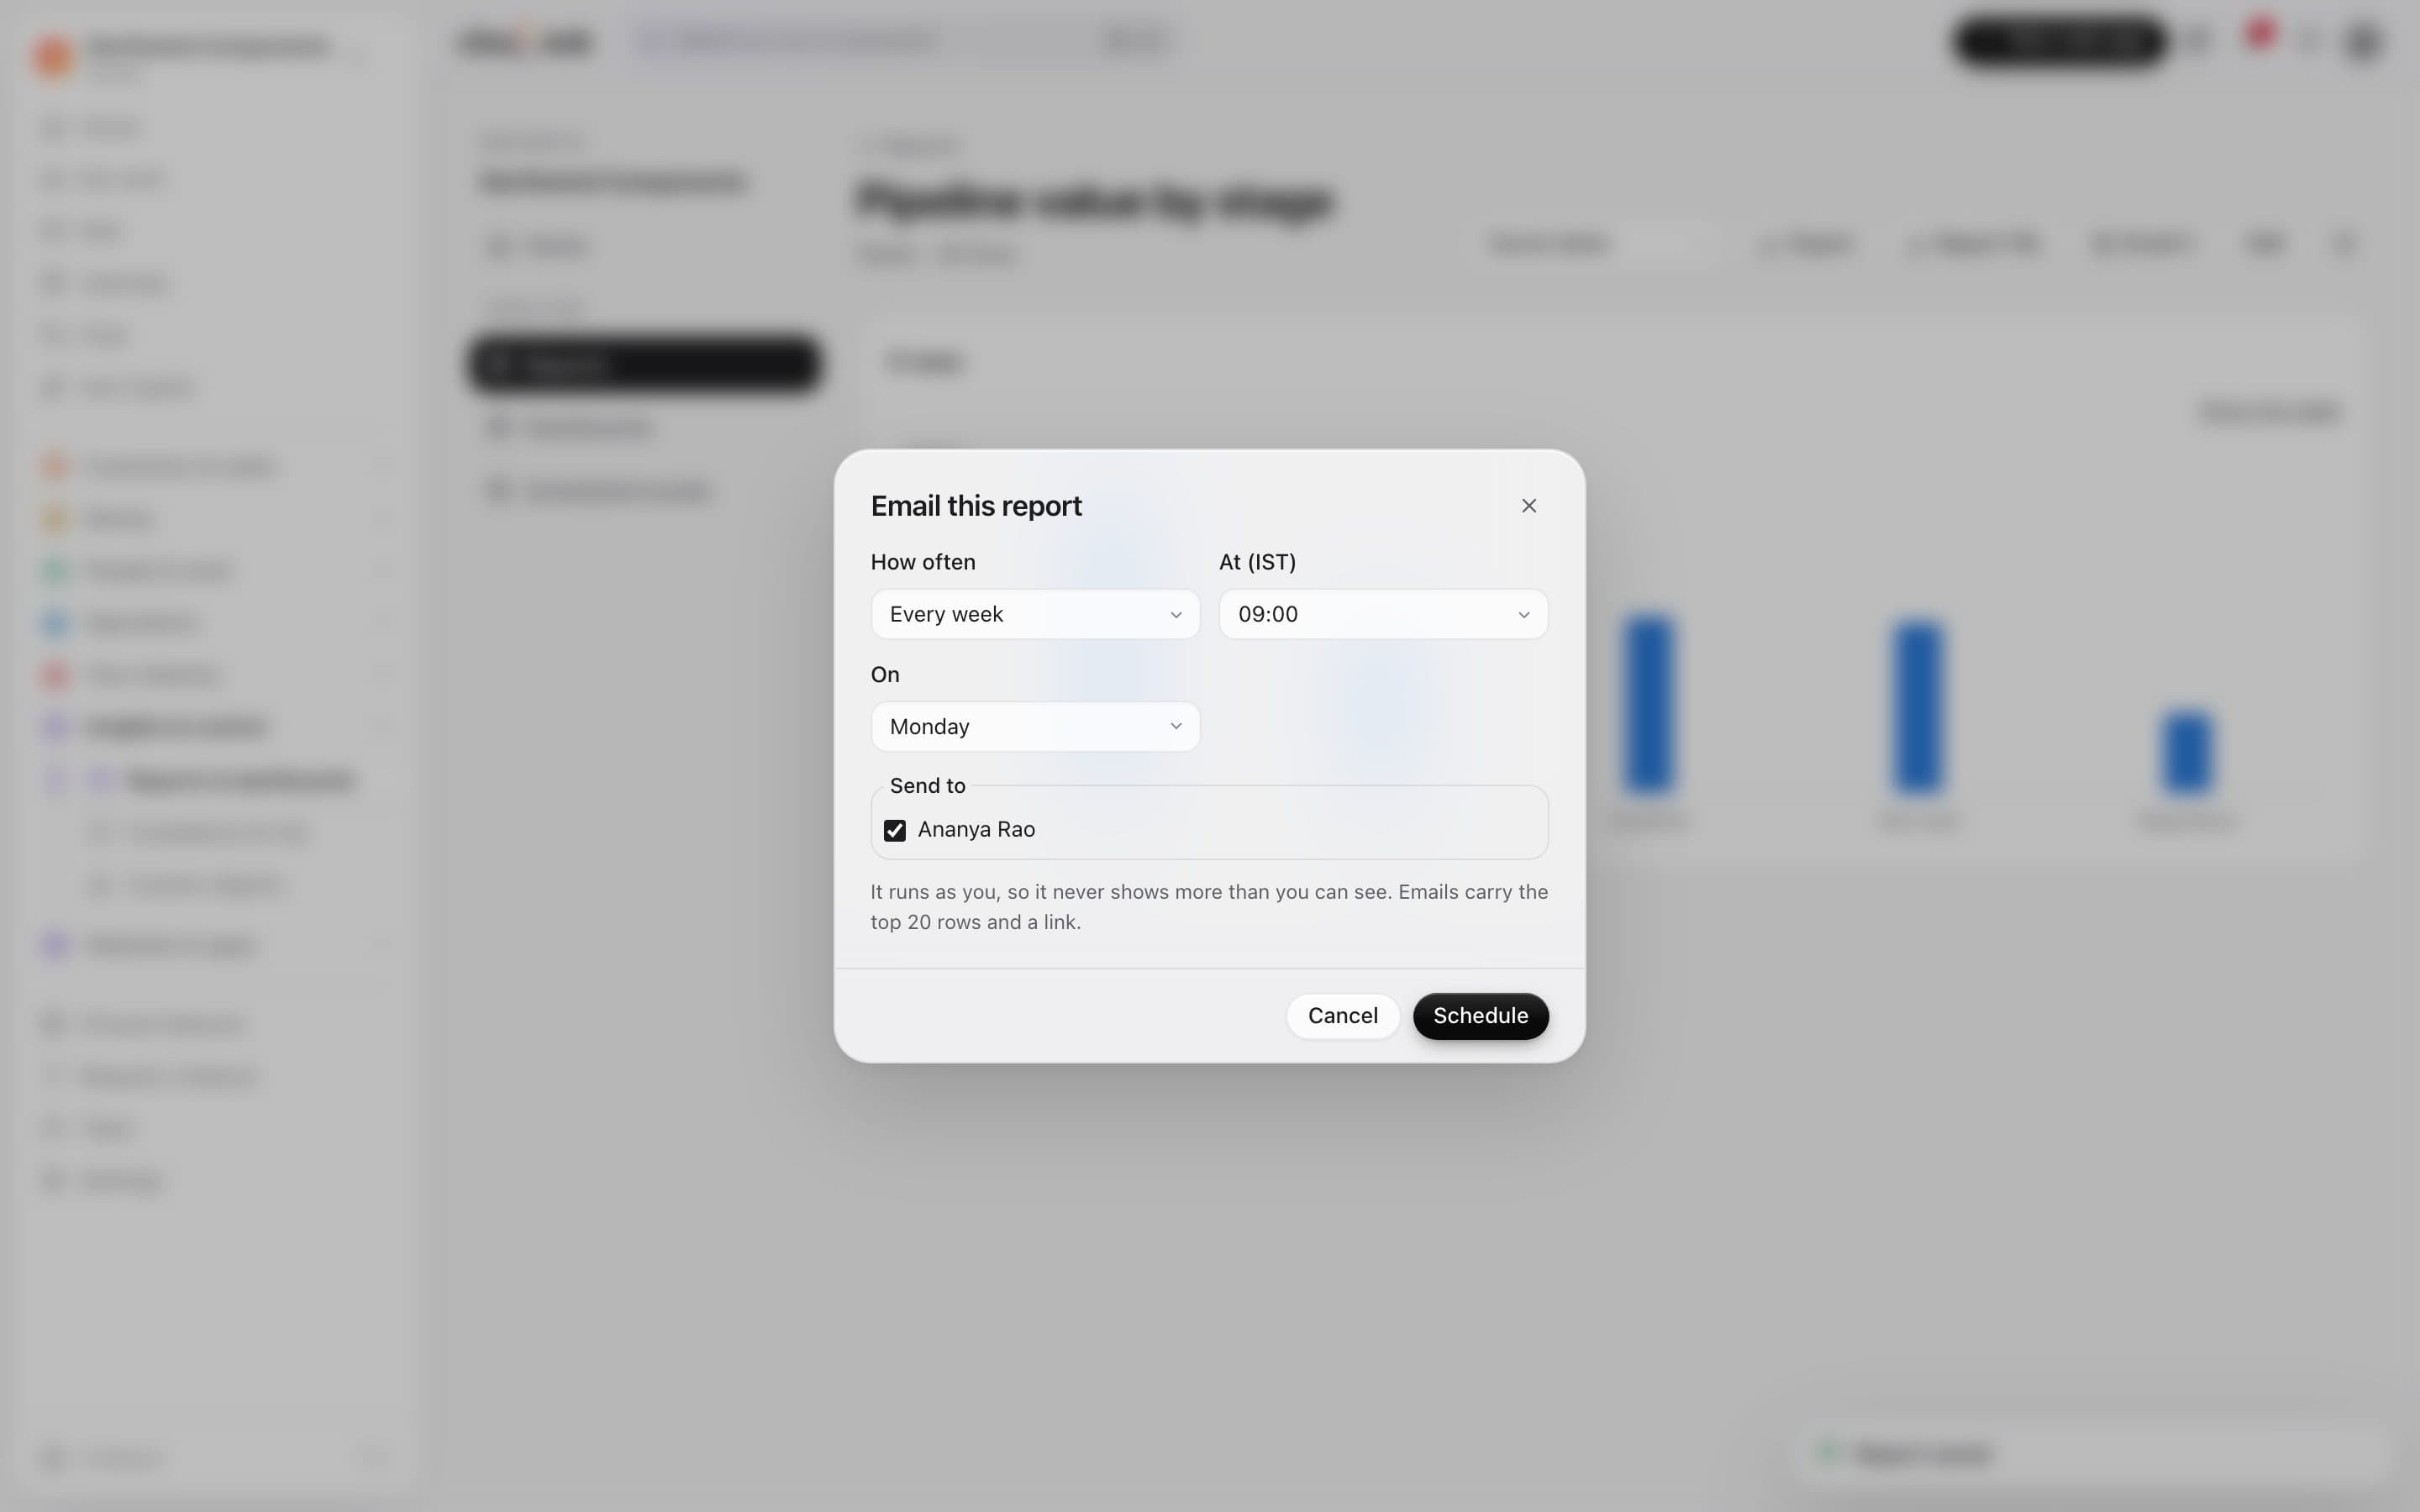
    Email any report daily, weekly or monthly to people on your team. It runs as you, so it never shows more than you can see.

    • Daily, weekly or monthly
    • Top rows in the email, with a link
    • Sent to chosen team members
    Scheduling a report to be emailed every Monday at 9:00

In detail

What you get with Cloudesk Reports & dashboards

Every module, one builder

Money, selling, operations and people datasets, each limited to your workspace and to what your role can see — a sales rep who only sees their own deals only reports on their own deals.

Good to know

We'd rather be upfront than surprise you later:

  • Reports are built from fields we've defined for each dataset — there's no free-form SQL. Up to 1,000 rows are shown per report.
  • Scheduled emails are plain text with the top 20 rows and go through your workspace's email setup.
  • Salary fields are only available to people who can run payroll.

Questions people ask

Why does someone see different numbers in the same report?+

Reports run as the person looking: a rep limited to their own CRM records, or someone without payroll access, sees only what their role allows.

How is the financial year worked out?+

From the month your accounting year starts in (April by default), so 'this financial year' on 24 October 2026 is 1 April 2026 to 31 March 2027.

Works beautifully with

Give it a spin — it's free to start.

Next up: Cloudesk Customer & supplier portals →

Start free